
Before buying shares in a public company, many investors review its financial statements to understand how the business earns money, what it owns and owes, and how much cash it generates. The documents can look dense at first, but the core statements follow a consistent structure, and a few key sections tell most of the story. This guide explains what to look for and how the pieces fit together.
Table of Contents
- The Four Core Financial Statements
- Reading the Balance Sheet
- Reading the Income Statement
- Following the Cash Flow Statement
- Checking the Footnotes and Management’s Discussion
- Where to Find Public Company Filings
- Common Ratios for Comparing Companies
- Frequently Asked Questions
- Bringing It Together
The Four Core Financial Statements
Public companies in the United States typically present four primary financial statements. Each one answers a different question, and each covers a different time frame. The SEC’s Beginners’ Guide to Financial Statements is a useful starting point for definitions of these documents.
Reading the statements together gives a more complete picture than reading any one of them alone. A company can report a profit on its income statement while its cash flow statement shows little cash coming in, which is why investors usually compare the documents rather than relying on a single headline number.
Reading the Balance Sheet
The balance sheet is a snapshot of a company’s financial position at the end of a reporting period. It follows the basic accounting equation: assets equal liabilities plus shareholders’ equity. When reviewing it, investors often focus on a few areas:
- Current assets: Cash, short-term investments, receivables, and inventory that the company expects to convert to cash within one year.
- Current liabilities: Obligations due within one year, such as accounts payable and short-term debt.
- Long-term debt: Borrowings due more than one year away, which can affect how much financial flexibility the company has.
- Shareholders’ equity: The residual value attributable to owners after liabilities are subtracted from assets.
Comparing current assets with current liabilities gives a rough sense of short-term liquidity. Trends matter as well. A balance sheet from one quarter is less informative than a series of balance sheets showing whether debt is rising or cash is building over several periods.
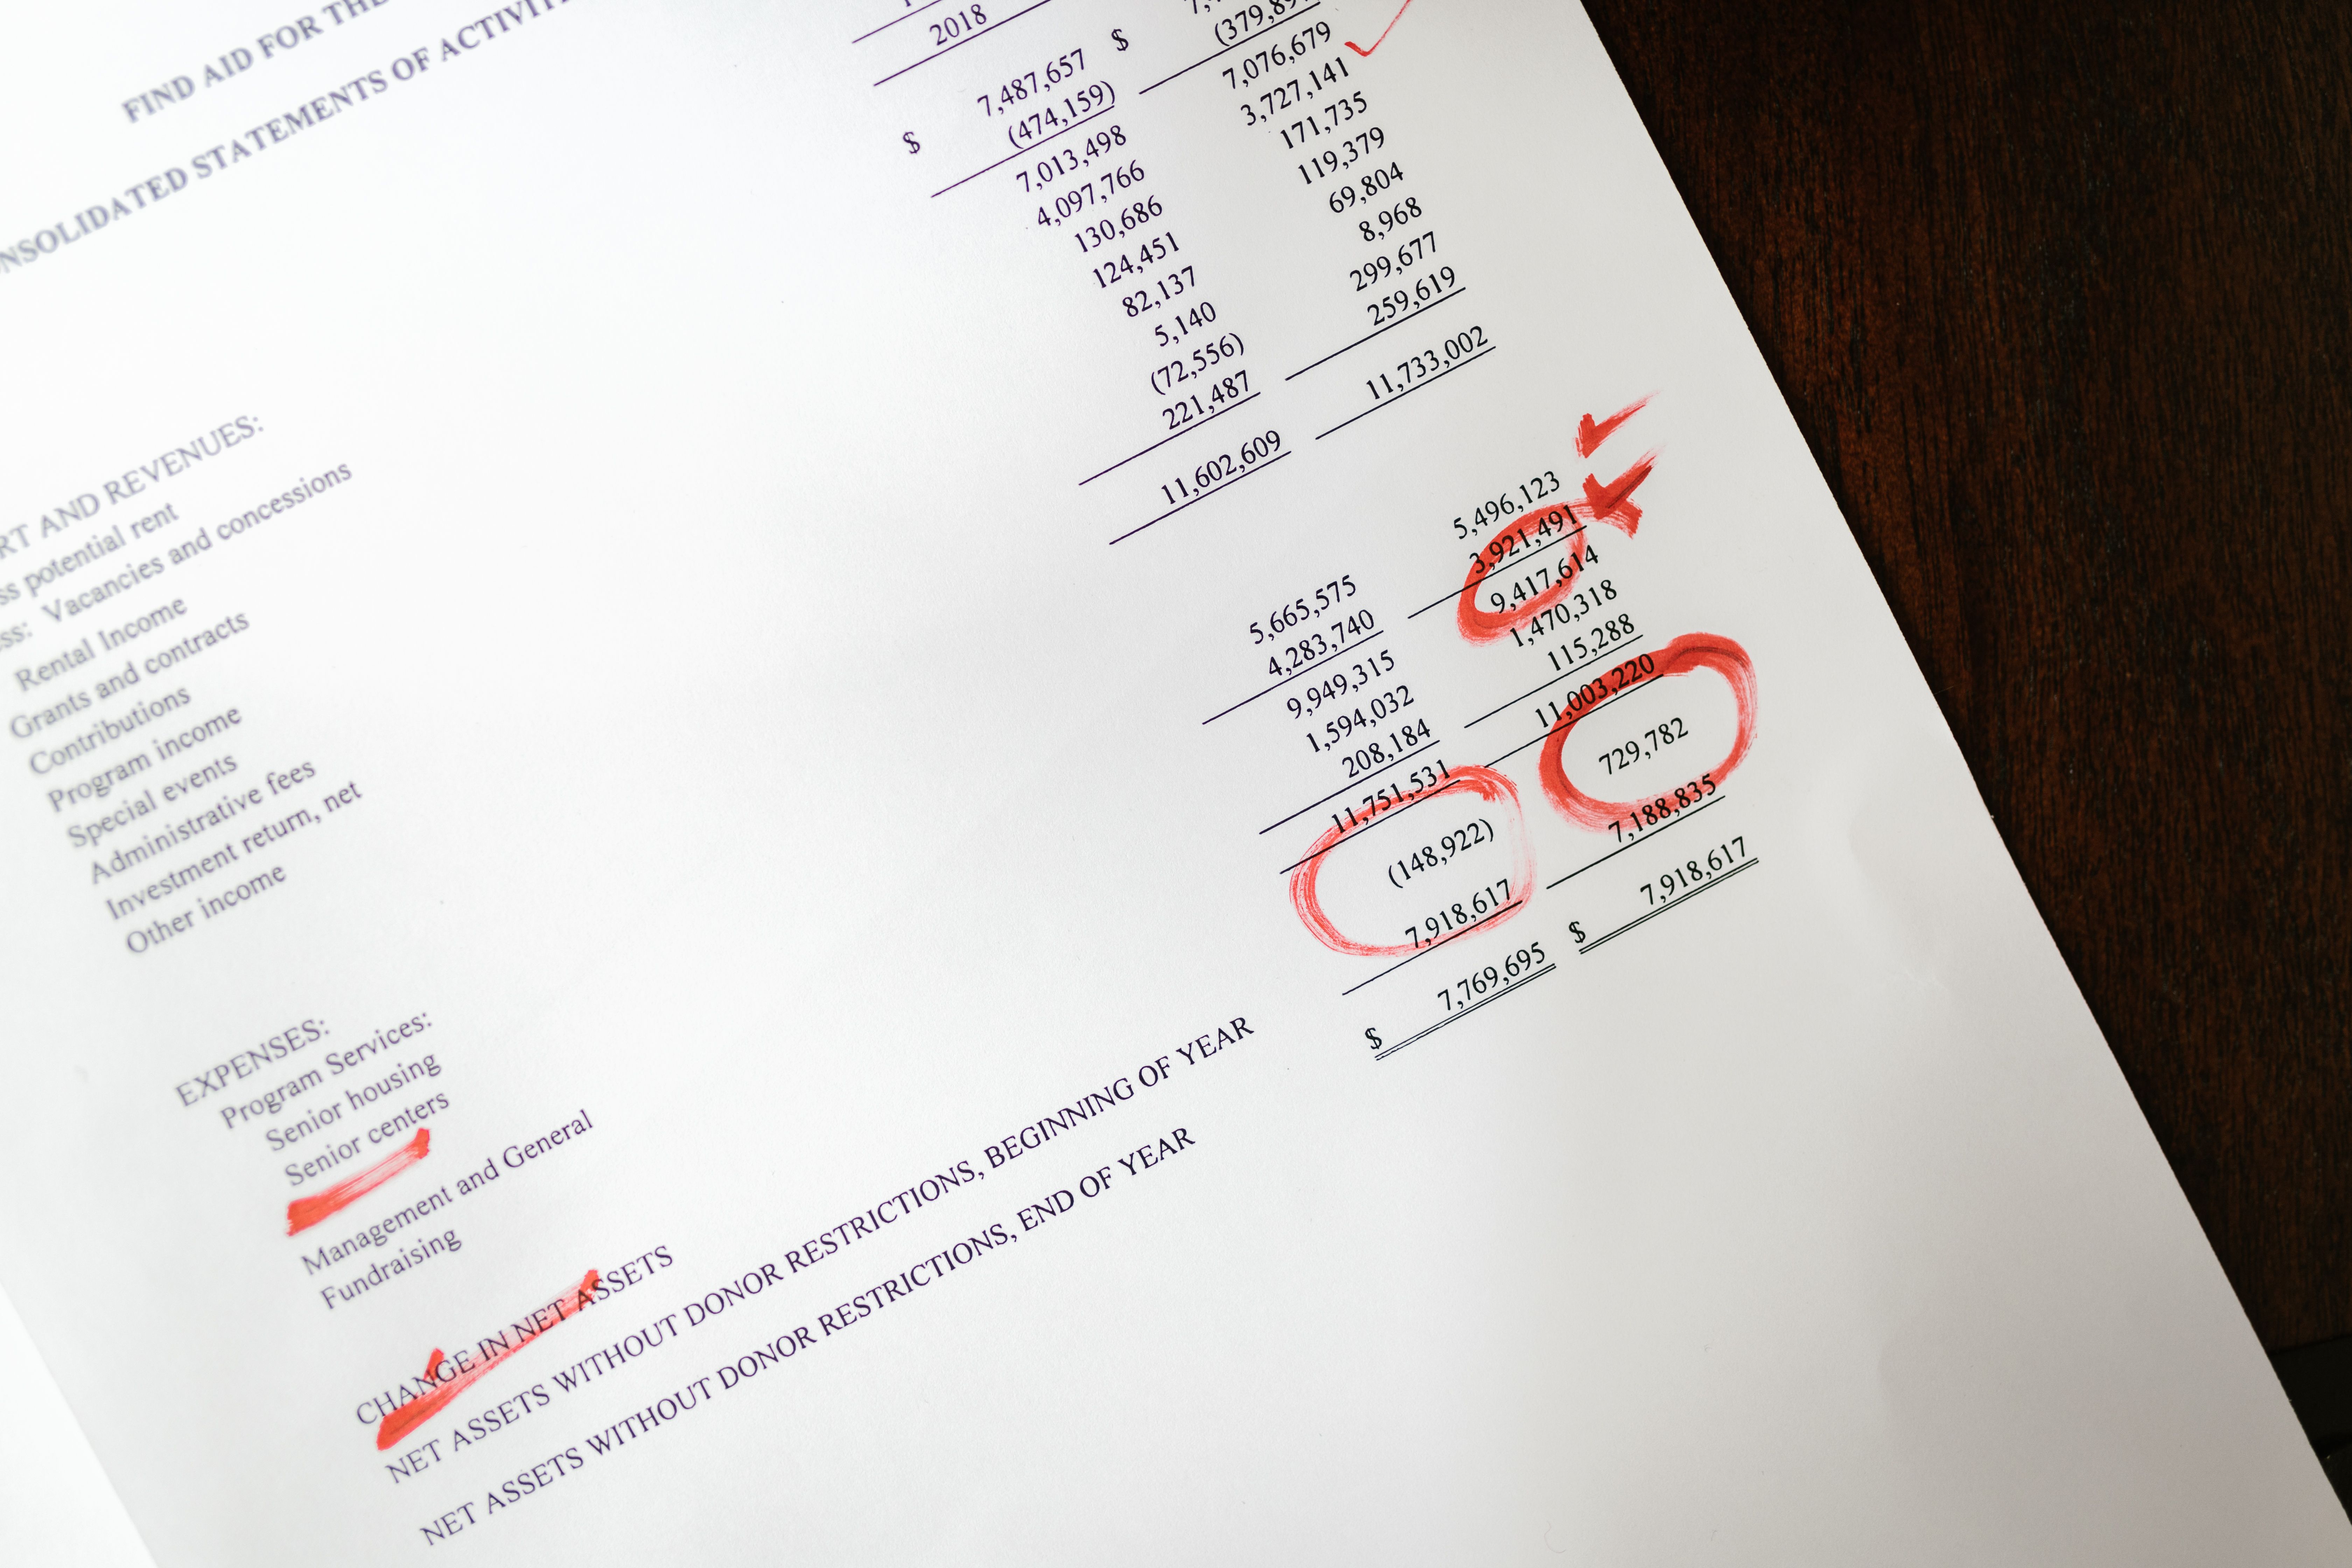
A financial statement marked up with notes, a common step when comparing balance sheet line items over time.
Reading the Income Statement
The income statement, sometimes called the statement of operations, starts with total revenue and works down through the costs of producing goods or services, operating expenses, interest, and taxes. The result is net income or net loss for the period. The Investor.gov guide to reading a 10-K describes how this statement fits within a company’s annual report.
A few lines tend to draw the most attention:
- Gross profit: Revenue minus the cost of sales, which indicates how much is left to cover operating costs.
- Operating income: Gross profit minus operating expenses such as research, marketing, and administration.
- Net income: The bottom line after interest, taxes, and other items.
- Earnings per share (EPS): Net income divided by the number of outstanding shares, which helps investors compare results across companies of different sizes.
Revenue growth alone does not show whether a business is becoming more profitable. Investors often check whether margins are holding steady or changing over time.
Following the Cash Flow Statement
The cash flow statement tracks actual cash movement. Because it adjusts for non-cash items such as depreciation, it can show a different picture than net income. Cash flows are usually divided into three categories:
- Operating activities: Cash generated or used by the company’s core business.
- Investing activities: Cash spent on or received from long-term assets, such as equipment, property, or investment securities.
- Financing activities: Cash from borrowing, repaying debt, issuing stock, or paying dividends.
Many analysts pay close attention to operating cash flow. A business that consistently produces more operating cash than net income may be in a stronger position to fund its own growth, though the right comparison depends on the industry and the company’s stage of development.

Calculating margins and cash ratios from the statements is a routine part of company analysis.
Checking the Footnotes and Management’s Discussion
The notes to the financial statements are often where important context appears. They can describe accounting policies, income tax details, pension obligations, stock-based compensation, and contingent liabilities. Investors who skip the notes may miss information that explains why a number looks the way it does.
The Management’s Discussion and Analysis (MD&A) section offers management’s narrative explanation of results, trends, and known risks. It is useful for understanding the reasons behind changes in the numbers, though it is written from the company’s own perspective and should be read alongside the audited figures. For background on how corporate financial reporting and uncertainty are presented, the notes and the auditor’s report are generally the most direct places to look.
Where to Find Public Company Filings
In the United States, public companies file reports with the Securities and Exchange Commission, and most of these filings are available through the SEC’s EDGAR database. The most common filings include:
- Form 10-K: The annual report, which includes audited financial statements for the full fiscal year.
- Form 10-Q: The quarterly report, which includes unaudited financial statements.
- Form 8-K: A report of certain material events, such as major corporate changes, filed as they occur.
Companies outside the United States follow different filing regimes, so investors should confirm which reports apply to the company they are reviewing.
Common Ratios for Comparing Companies
Ratios make it easier to compare companies of different sizes. The table below lists several widely used measures. Acceptable ranges vary considerably by industry, so ratios are most useful when compared with close peers and with the same company’s history.

Charts of price and financial trends can be compared with the figures reported in the statements.
Frequently Asked Questions
Which financial statement should I read first?
Many investors start with the income statement for a sense of revenue and profit, then move to the balance sheet and cash flow statement to check financial health and cash generation.
Is a profitable company always a good investment?
Profitability is one factor among many. Cash flow, debt levels, competitive position, and valuation also matter, and a profitable company may still face risks that the statements do not fully capture.
Do I need an accounting background to read financial statements?
No specialized degree is required to understand the basic structure of the statements, although more advanced analysis benefits from accounting knowledge. Reading the footnotes and MD&A is a practical way to build understanding over time.
Bringing It Together
Reading a company’s financial statements is less about memorizing terms and more about asking consistent questions. Does the balance sheet show a manageable level of debt? Does the income statement show revenue and margins moving in a sensible direction? Does the cash flow statement confirm that reported profits are turning into cash? Answering these questions across several reporting periods, and against industry peers, gives investors a clearer basis for their own decisions. Financial statements are one part of research, and they work best alongside other information about the business, its industry, and its risks.